Google Tag Manager End Google Tag Manager Fav Icon Bootstrap Meta tags include Energy monitoring system | See how it works - IAM | Energy Management Technology Google Tag Manager (noscript) End Google Tag Manager (noscript)
×

Smart Energy Management System

Improve your bottom line by electricity monitoring & saving

IAM - SMART ENERGY MONITORING SYSTEM makes it easy to access & monitor office and industry energy consumption to identify the excessive energy usage of different equipment in premises of the industry anytime, anywhere which makes energy saving easier. Our IoT Based Energy Monitoring System has saved people up to 25% off their electricity bills of our clients by raising their awareness. Our aim is to create a sustainable world with its IoT technology and people expertise to lower costs, drive efficiencies and reduce environmental impact. Let’s understand how this technology works, customised & generates the report.

Current Issues

Inefficient usage of assets ( Air conditioning and Lighting)

  • Massive inefficiencies in energy consumption at retail stores
  • Penalties because of Power Factor and demand load
  • By increasing the temperature by 1 degree we can save 1% of the energy
  • Air Conditioning accounts for over 60% of energy bills
  • Over comfort to customer ( 24 C required but maintained at 20 C)
  • Unused or over used equipment causes abnormal energy consumption

Lack of maintenance

  • Maintenance is either on a scheduled basis or on a break-down basis
  • Old equipment reduces efficiency
  • List of installed assets with their aging is usually not available
  • Lack of tracking maintenanceactivities and its benefits

Lack of monitoring and control

  • Energy audits are done only for compliance needs
  • Energy consumption Information is not available to branch manager in real-time
  • Over reliance on human intervention
  • No centralized monitoring of energy consumption
  • All energy conservation measures are reactive.
Request to Call Back +91-70451 61874

Methodology

Energy saving using patented technology

energy-monitoring-how-it-works-line-graphics

Data Collection & Analyse

Check the power consumption trend and past records

Remote Monitoring & Control

Designed device network to control energy consumption

Manage by exception

Gives the magnitude & optimised result by continous monitoring

Predictive & prescriptive maintenance

Reducing your ecological carbon footprint of energy

Energy Monitoring Solutions

Load Side Saving & Power quality improvement Energy Monitoring Power availability monitoring Energy Management Centralized Monitoring
Solution
  • E-PowaTrim
  • E-Optimize
  • 6 to 8 % Energy Saving
  • E-SmartMeter
  • Data collection is important for management
  • E-UPS,DG monitoring
  • Increase power availability
  • Improves business availability
  • E-IoT Control
  • 12% to 18% Energy saving
  • E-CMS Monitor
  • Manage Centrally
Benefits
  • Improves power quality
  • Helps stabilize voltage and reduces input noise
  • Saves Energy
  • Avoids load in-balance
  • Monitors multiple parameters
  • Helps improve energy saving
  • Keeps an eye on critical parameters like power factor
  • Online audit of energy reduces physical audit
  • Monitor DG parameters like consumption, fuel level, battery, runtime, usage
  • UPS parameters like batter level, output voltage
  • Improves efficiency of DG and UPS
  • Control AC/ HVAC with smart schedule
  • Keep adequate temperature to save energy
  • Capture all failure parameters
  • SOP based AC/HVAC control
  • Centralized asset management
  • Tracking energy from central location
  • Realtime audit and health report
  • Preventive maintenance
  • AMC management

Key Features

Energy Monitoring will reduce Electricity Bills upto 20%

  • 24x7 Real-time energy usage analytics via Mobile App & Web platform.
  • Remotely switch ON/OFF any machine.
  • Reports all electrical conditions to a dashboard that is constantly evaluating electrical risks.
  • Identifying Energy Wastage
  • Real-time energy monitoring & advance alerts
  • Compatible with mostly all devices
  • Control AC as per standard ( No warranty issues)
  • Unlimited customizability and adaptability to current solutions.
  • Get ROI within 1 year
  • 15% to 20 % energy saving
  • Predictive maintenance management
  • Green building compliant
  • Wifi and Wireless - IoT Solution
  • Use same IR remote interface to control AC
  • Centrally managed system and reports

Download Brochure

Data Navigation

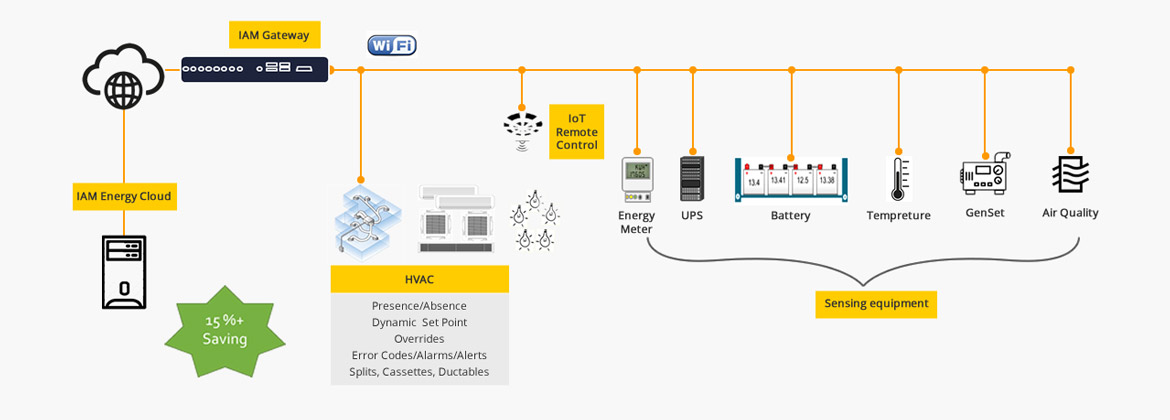
Electrical energy consumption related data is treated and reflected within the system and then this data is transfered to the LAN or Cloud server. Advanced Analytics feature helps you to gather data and process it to develop energy consumption patterns, compare historical consumption, and predict future energy needs.

IoT Solution for energy control - HVAC

energy-monitoring-data-navigation
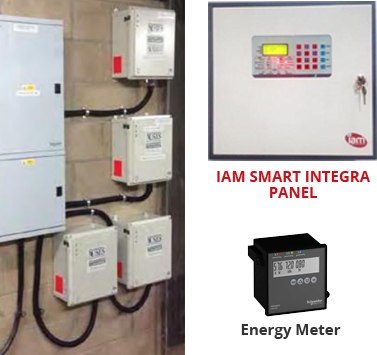
IAM-Smart-Integra-Panel-and-energy-meter
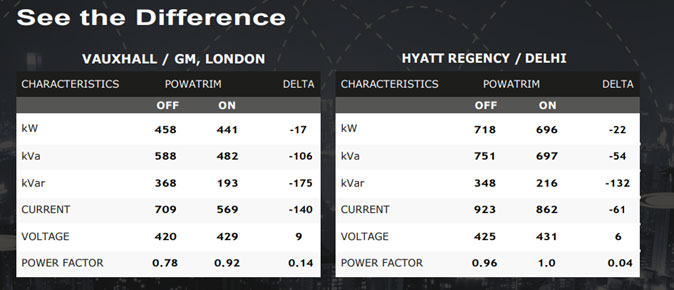
energy-monitoring-see-difference

Reports Dashboard

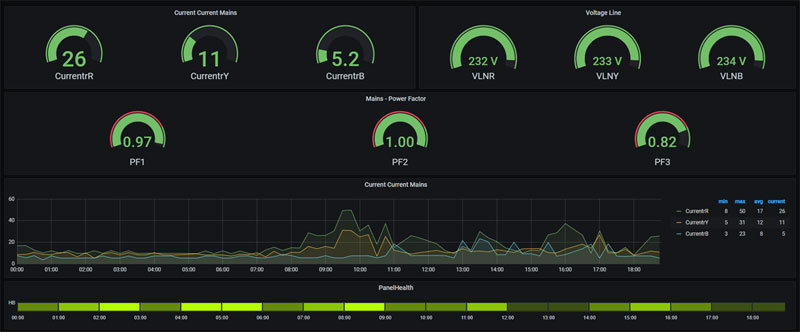
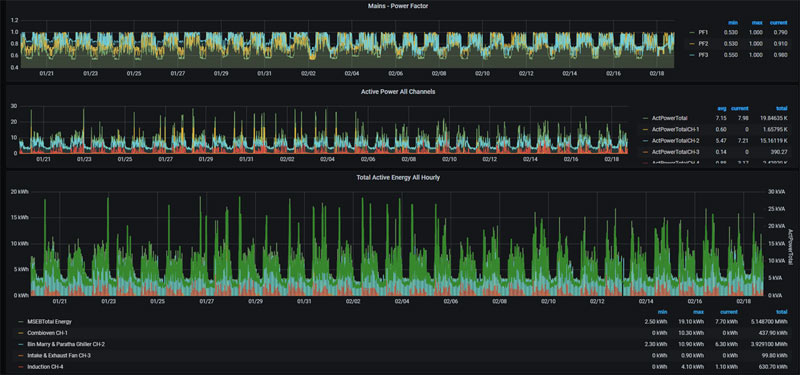
Authorised person can only access the dashboard. Data plays an essential part to comprehend the behaviour of energy consumption and also to rectify the undesirable energy use in the business. Data charts and visualization helps you to comprehend the information easily. TThe visual representation of data enables you to identify operational inefficiencies and mitigate them by taking strategic actions.

  • Alerts with email/sms is sent to the authorized person
  • Energy Graph: Active power R/Y/B graph and data
  • Energy consumption data in tabular format
  • Zone details: like active zone
  • Bar graph for Events

Reports Methodology

Reports - Current status of energy parameters
  • Current status of energy parameters i.e. Current, voltage, power factor, etc.
  • Along with health status of the system.
Reports - Energy consumption
  • Energy consumption – Cumulative (incomer) and of distributed load.
Reports - Energy consumption Alert Management
  • Alert Management for active parameters.
Reports - Periodic comparison
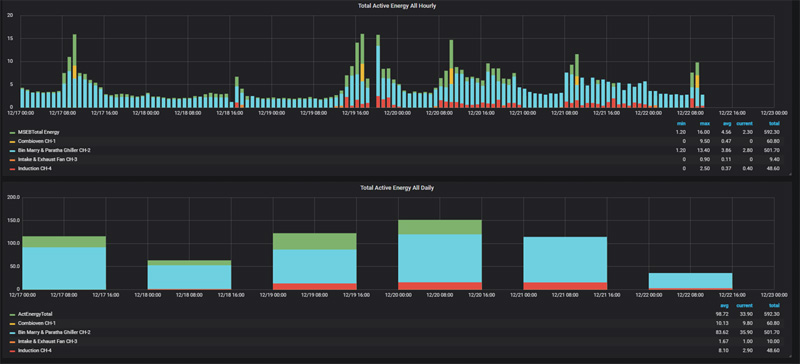
  • Periodic comparison – Daily, weekly, monthly and for selected period for quality and quantity analysis of energy / power.
Reports - Temperature Monitoring
  • In this Graph you can see temperature variation in selected time period.
  • Also you can see the minimum, maximum and average temperature.
Reports - dashboard-energy-monitoring-for-time-period-in-kW
  • This graph shows energy consumption for selected time period. kW
  • This will help to monitor frequent increment in energy.
Reports - dashboard-energy-monitoring-for-time-period-in-kVA
  • This graph shows power consumption and spike in particular time for selected time period. kVA
  • This will help to monitor power consumption pattern.
Reports - dashboard-energy-monitoring-for-time-period-in-kWh
  • This graph shows Energy consumption for selected time period. kWh
  • Hourly, Daily, weekly and monthly.