Automated Occupancy Monitoring System for Retailers

COVID-19 has created huge amount of change the way retail stores will function. Social distancing is must and customer also expects same from retail stores. To keep adequate Social distancing no. of customer inside stores should be restricted but unable to control through manual methods. AIM - RealCount people counting technlogy further integrated with Automated Occupancy Control system & Audio –Visual Display that to provide a more cost-effective and efficient way to abide by these safety regulations during the global pandemic. It is 98% reliable and is one of the safest in the market, its main benefits include increased efficiency in occupancy control, automatic access control, and the possibility of real-time information thanks to its modular system, making it a non-invasive, effective solution that improves the user experience.

Key Features

Occupancy Monitoring for retailers is now essential. It lets you know presence of people in your shop in real time.

  • People coming In and Out of store are counted using these devices.
  • System is capable of getting occupancy from multiple devices and display at the entrance.
  • At the Entrance of the store, display unit is installed which shows real-time count of store In/ Out and occupancy count.
  • Maximum occupancy is customisable on display device.
  • Staff count is programmable and is shown separately on display as staff count.
  • In case of increase in occupancy, the display shows alert in red colour with audio-visual indication.
  • Display unit is also capable of playing audio with pre-recorded message of COVID-19.
  • Display unit is programmable using remote control to manage different parameters.

Get a Free Demo today. We’re here to help you Request A Demo

Request to Call Back +91-70451 61874

Understand, How Does It Work?

People Counting Machine (PCM) installed at stores can be further used for occupancy counting.

  • Occupancy Display Controller is connected to the same Network where PCM is connected at the entrance of the store
  • It communicates with PCM device and gets real-time dashboard for occupancy data.
  • It Calculates Occupancy information and displays itin colour code.
    - Green (within the threshold) - Red (exceeding the threshold)
  • Capable of playing pre-stored Audio.
  • Use exiting PCM devices which requires 230V supply to power display and controller.
  • System works with single PCM unit as well.
people-count-how-it-works
Automated-Occupancy-Monitoring-Sys-how-it-works

Data Navigation

Know, how RealCount Device records incoming & outgoing footfall & with support mechanism generate the fruitful reports for users

  • Different Colour indication for GO and WAIT.
  • COVID-19 Message at bottom.
  • Alert indication like Cleaning in progress can be shown
  • Background COVID-19 audio messages.
  • Audio Indication if Occupancy limit is crossed.
  • Multiple display units can be installed at different location.
Automated-Occupancy-Monitoring-Sys-data-navigation

Download Brochure

Reports Dashboard & Methodology

We use Smart people counter, robust data processing software. It is a user-friendly dashboard easy to navigate and quickly generate custom reports. The system is highly scalable that 1000s of users can be accommodated and it is aggregated with multiple ERPs and DSS integration options. Enterprises distributed architecture, with auto-update/mailer support.

people-counting-how-it-works

Reports Methodology

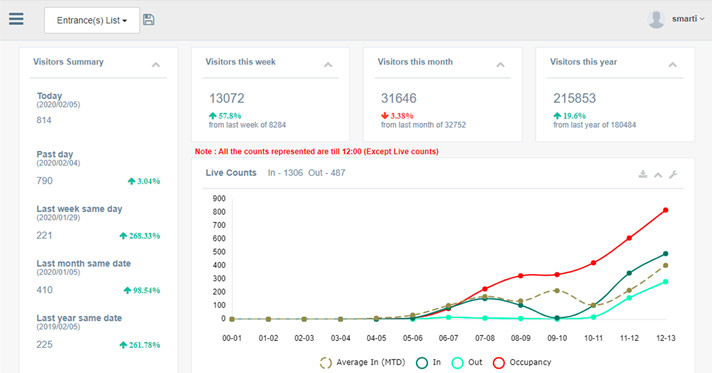
Footfall from all stores, Know daily, weekly, monthly, yearly trends. Compare WTD, MTD and YTD with % variance. Analyse Current footfall counter trend.

Reports - History Comparison

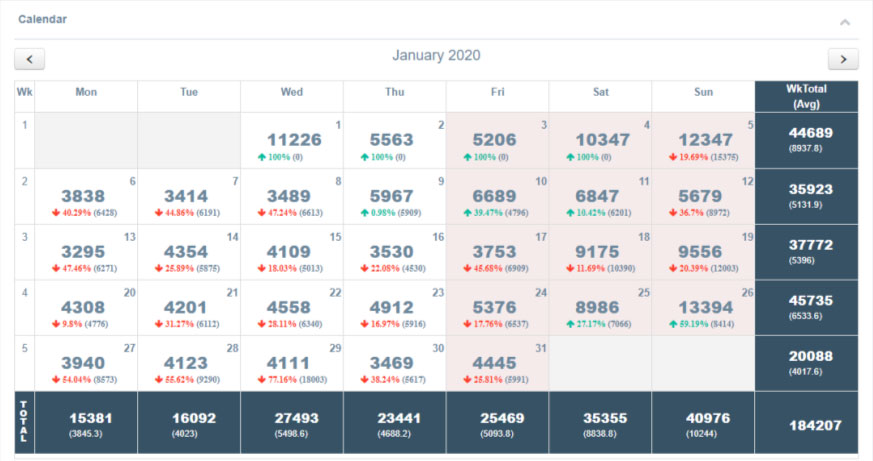
Calendar dashboard shows day to day comparison respective to same week numbers in previous month, Days which are in 5th week or no match to compare show zero data, All weekends are highlighted, It shows average & total counts of week, all individual days & sum of month.

Reports - dashboard-calendar

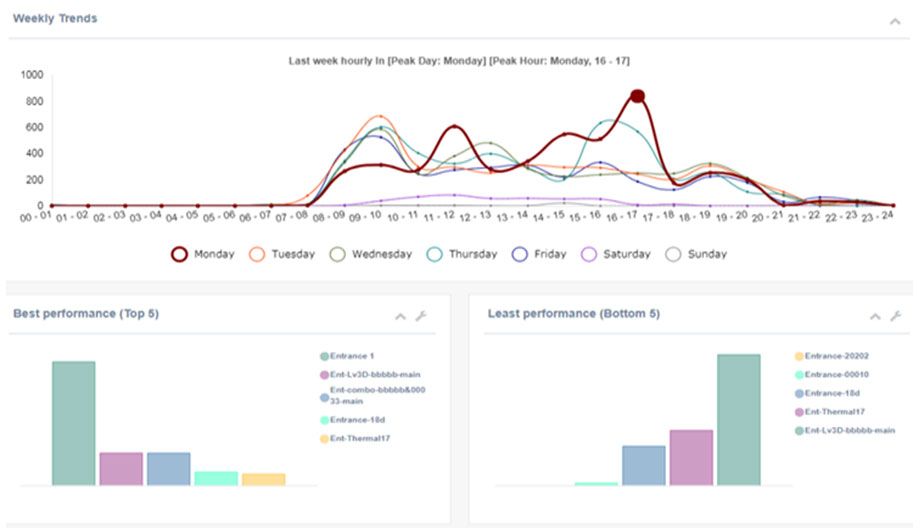
Footfall from all stores, Know weekly trends, Past week count, Best 5 top performer of the week, Best 5 bottom performer of the week, Highest traffic hour, Highest traffic day.

Purpose: Incentive to store manager, Staffing management, Week planning

Reports - dashboard-hour-trend

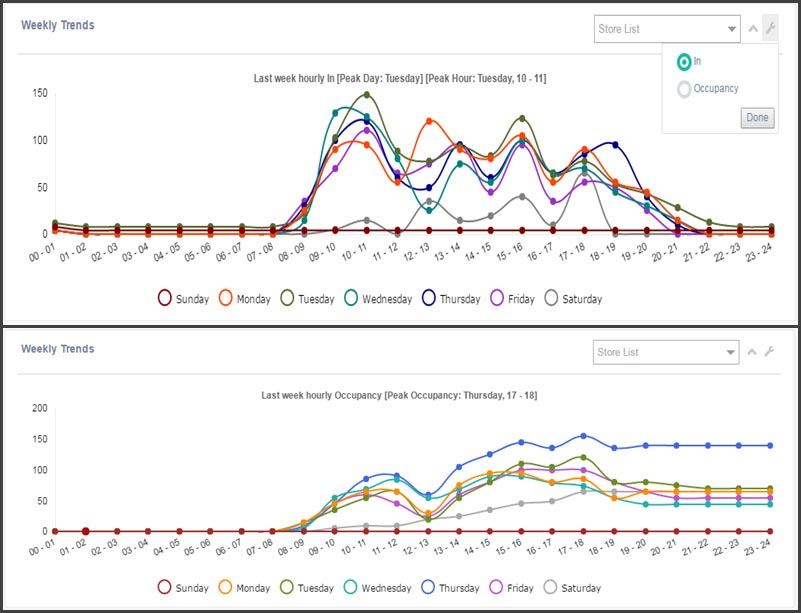
Single screen view shows footfall trend of the full week. Peak foot fall day and peak hours of traffic, Similar reports from occupancy data offer busy timings of the retail hours, Live Occupancy is an indicator of peak & low hours of customer’s shopping timings, These data help to decide staffing and in store advertising, promotional strategy.

Reports - dashboard-week-trend

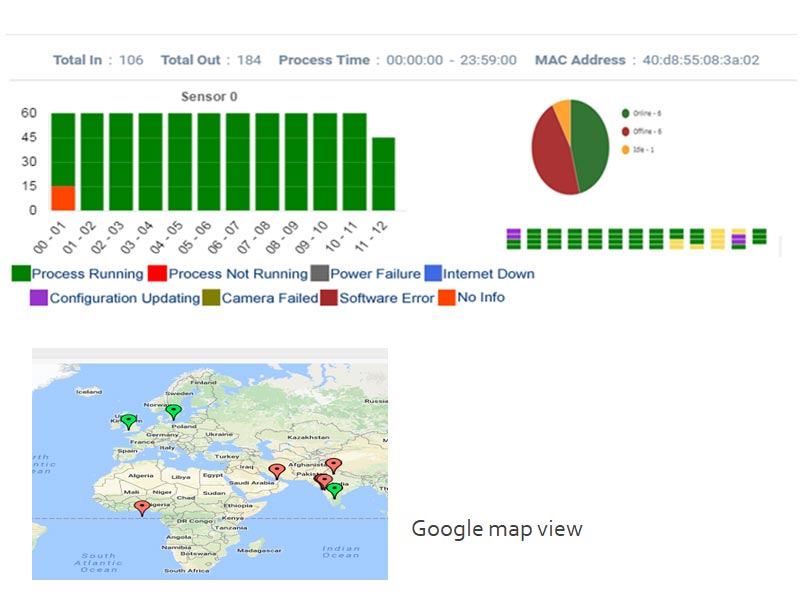
Device Uptime, Device power/ network/ device issues reporting and auditing, Past data to compare total system uptime, Auto email in case device offline for specific time, Google map helps immediate action for nearby service person, Keep system up and running, Incentive to operational team for maximum uptime.

Reports - store-device-health

Reports Methodology

  • Region wise comparison
  • Store and region wise sales conversion
  • WTD, MTD, YTD, past to and today, event to event comparison
  • Historical data and future prediction
  • Advertisement impact
  • Big day and New launch impact (Apple 10 release)
  • Discounting and scheme impact
  • Local/Festival events and product planning
  • Customer crowd management
  • Customer hygiene management
  • Store opening and closing time management using and first and last people counter data
  • Big day sale prediction and stocking
  • Product profiling by day and event
  • Sales staff management (low and busy hours)
  • Security and housekeeping staffing decision
  • Big day staffing management
  • Change in % headcount because of new product launch
  • Get information of effect of new product launch vs count vs sale
  • Cross selling because run-rate product of Brand product new launch
  • New marketing campaign customer pull feedback
  • Discounting campaign customer pull feedback [% increase compared previous data]
  • Big sale campaign customer pull feedback [% increase compared previous data]
  • Spike in sale on specific data
  • Comparison with last 5 year data
  • Week pattern
  • Day pattern