3D IR IoT based Technology – Smart People Counting systems

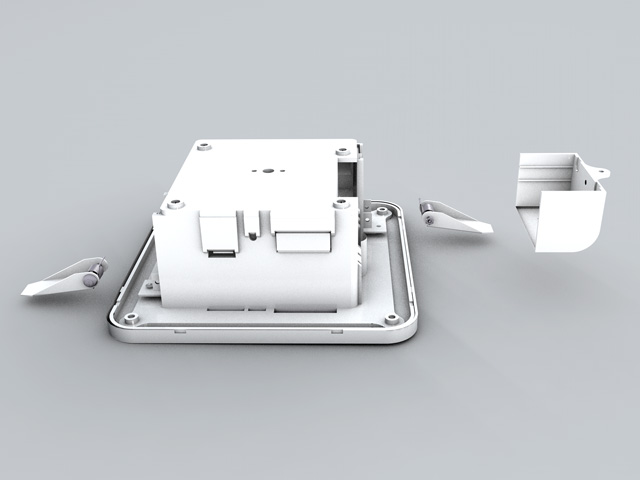
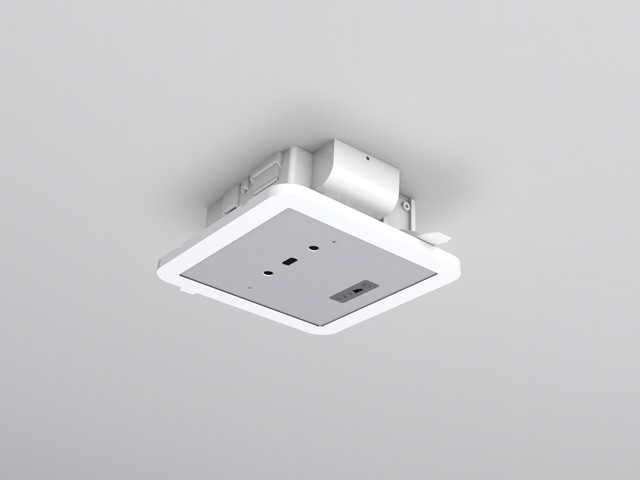
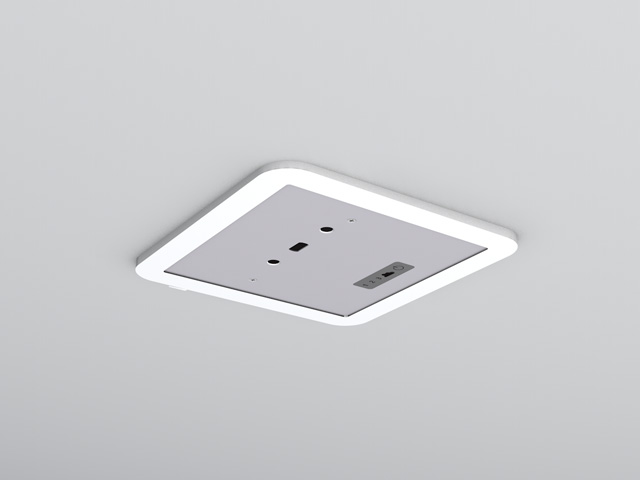
Our REALCOUNT DEVICE uses the most advanced 3D IR IOT based Technology with integrated Wi-Fi and Bluetooth support to accurately observe and extract useful information about shoppers entering and exiting each store, in different types of spaces & light. Visual information is managed inside the sensors by our neural networks. The resulting real-time data is wirelessly transmitted to our cloud application for storage and analytics or accessed in real-time through IAM software. Get deep understandings into your retail operations and marketing initiatives and grow a comprehensive understanding of customer behaviour and interaction within your stores.

Key Features

Most accurate cutting-edge people counting technology/tracking sensor with advanced capabilities

  • High precision of detection - 98% + Accuracy
  • The embedded device with built-in analytics
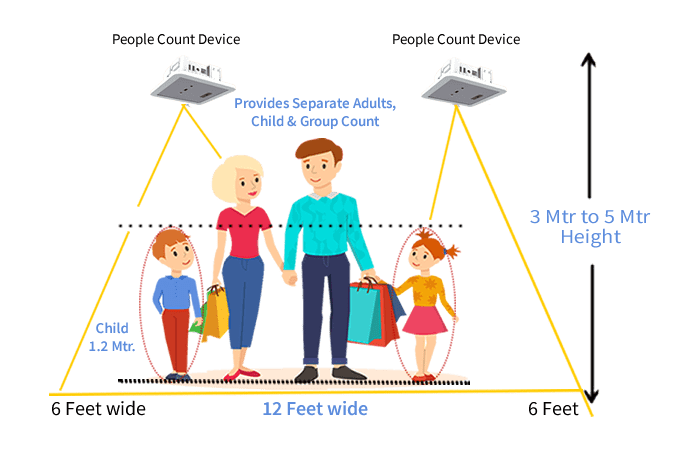
  • Differentiates adult, child & group sizes
  • People and object detection differentiator
  • Cloud server with local storage
  • POE powered & compatible in every light condition
  • Camera for scheduled verification video
  • LED for easy debugging at store level
  • Visitor Counters & exit footfall
  • Occupancy counting possible

Understand, How it Works

Know Easy Installation and Calibration of 3D IR IOT - People Counting Device

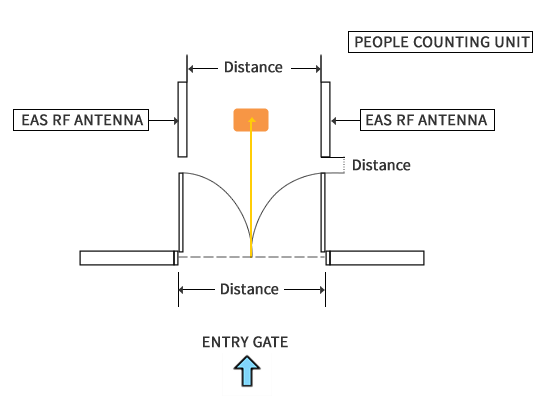
  • RealCount Device always placed at every entry & exit location of the store.
  • The unit gets installed at the entrance ceiling just above the EAS antenna.
  • It requires a minimum of 3 meters to Maximum 5-meters height from ground level.

Data Navigation

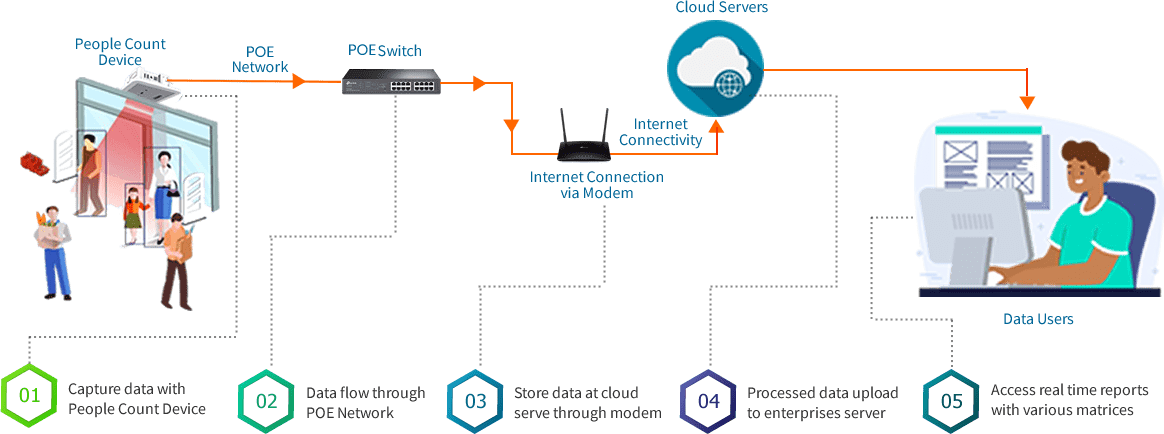
Know, how RealCount Device record ingoing & outgoing footfall & with support mechanism generate the fruitful reports for users

Data Navigation

Download Brochure

Reports Dashboard & Methodology

We use Smart people counter, robust data processing software. It is a user-friendly dashboard easy to navigate and quickly generate custom reports. The system is highly scalable that 1000s of users can be accommodated and it is aggregated with multiple ERPs and DSS integration options. Enterprises distributed architecture, with auto-update/mailer support.

people-counting-how-it-works

Reports Methodology

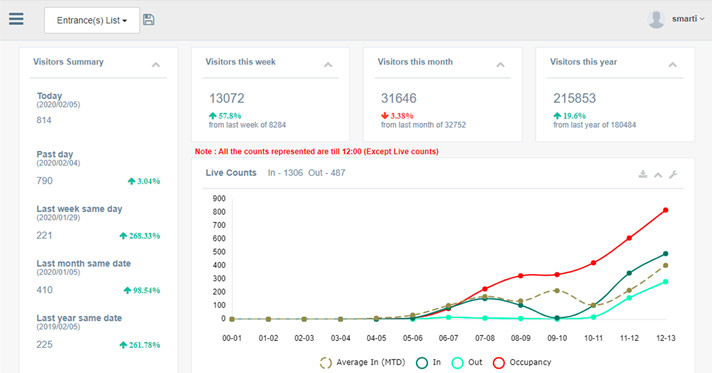
Footfall from all stores, Know daily, weekly, monthly, yearly trends. Compare WTD, MTD and YTD with % variance. Analyse Current footfall counter trend.

Reports - History Comparison

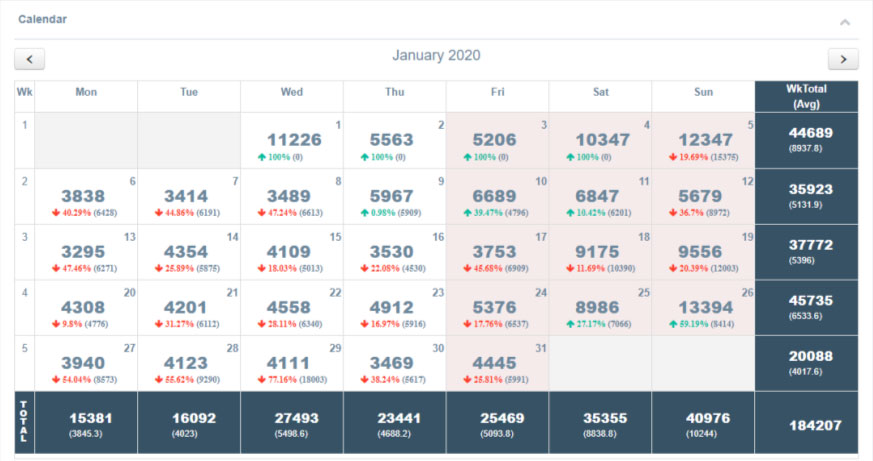
Calendar dashboard shows day to day comparison respective to same week numbers in previous month, Days which are in 5th week or no match to compare show zero data, All weekends are highlighted, It shows average & total counts of week, all individual days & sum of month.

Reports - dashboard-calendar

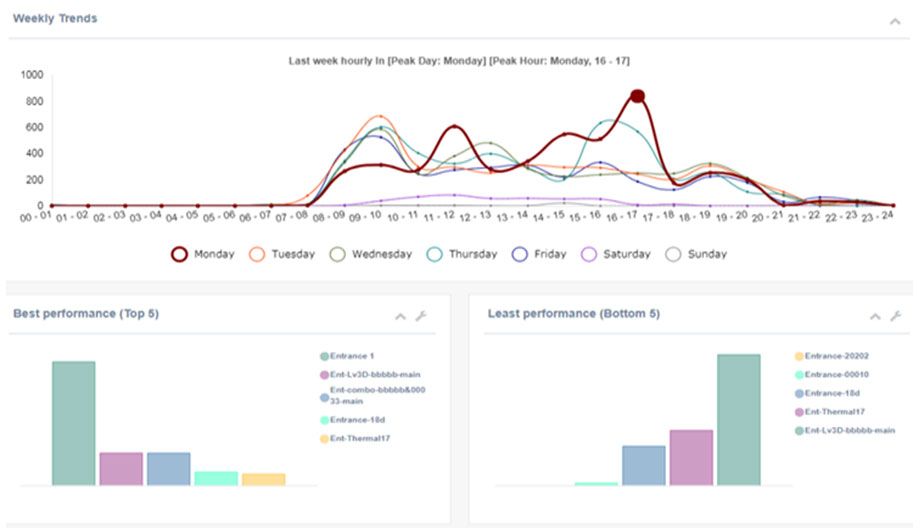
Footfall from all stores, Know weekly trends, Past week count, Best 5 top performer of the week, Best 5 bottom performer of the week, Highest traffic hour, Highest traffic day.

Purpose: Incentive to store manager, Staffing management, Week planning

Reports - dashboard-hour-trend

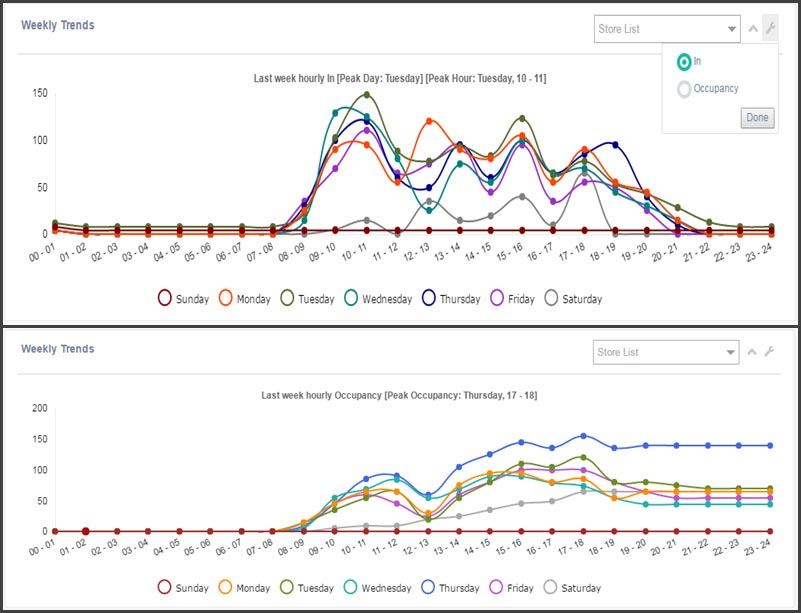
Single screen view shows footfall trend of the full week. Peak foot fall day and peak hours of traffic, Similar reports from occupancy data offer busy timings of the retail hours, Live Occupancy is an indicator of peak & low hours of customer’s shopping timings, These data help to decide staffing and in store advertising, promotional strategy.

Reports - dashboard-week-trend

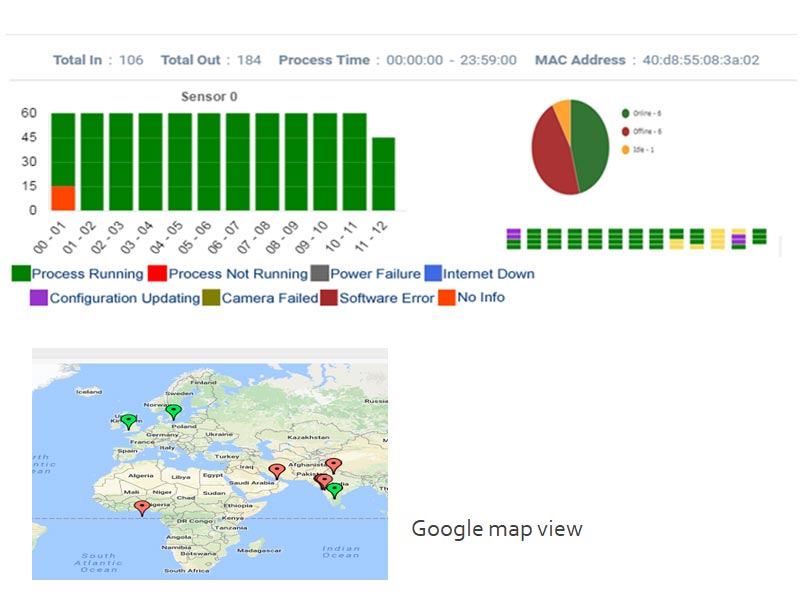
Device Uptime, Device power/ network/ device issues reporting and auditing, Past data to compare total system uptime, Auto email in case device offline for specific time, Google map helps immediate action for nearby service person, Keep system up and running, Incentive to operational team for maximum uptime.

Reports - store-device-health

Reports Methodology

  • Region wise comparison
  • Store and region wise sales conversion
  • WTD, MTD, YTD, past to and today, event to event comparison
  • Historical data and future prediction
  • Advertisement impact
  • Big day and New launch impact (Apple 10 release)
  • Discounting and scheme impact
  • Local/Festival events and product planning
  • Customer crowd management
  • Customer hygiene management
  • Store opening and closing time management using and first and last people counter data
  • Big day sale prediction and stocking
  • Product profiling by day and event
  • Sales staff management (low and busy hours)
  • Security and housekeeping staffing decision
  • Big day staffing management
  • Change in % headcount because of new product launch
  • Get information of effect of new product launch vs count vs sale
  • Cross selling because run-rate product of Brand product new launch
  • New marketing campaign customer pull feedback
  • Discounting campaign customer pull feedback [% increase compared previous data]
  • Big sale campaign customer pull feedback [% increase compared previous data]
  • Spike in sale on specific dat
  • Comparison with last 5 year data
  • Week pattern
  • Day pattern