Where Your Energy Actually Goes: The Business Case for Energy Monitoring
Every business knows what it pays for energy. Almost none can tell you what they’re paying for.
That gap is the entire problem. A monthly bill is a receipt, not a diagnosis — it confirms the money left your account without explaining which systems consumed it, at what hours, or how much of it was simply wasted. And the numbers underneath that receipt are larger than most operators assume.
The scale nobody budgets for
Start with the global picture. Energy demand isn’t flattening — it’s climbing, and the growth is concentrated in exactly the developing economies where most new commercial and industrial capacity is being built. Current projections put global energy consumption rising 34% between 2022 and 2050, from 638 quadrillion Btu to 855, with the industrial sector alone growing anywhere from 9% to 63% depending on the scenario. Rising demand against constrained supply points in one direction for anyone buying electricity: upward.
Now narrow the lens to the buildings themselves. Buildings account for roughly 40% of global energy consumption — meaning the offices, stores, warehouses, and plants your business occupies are not a minor line item in the world’s energy problem. They are the problem, and equally, the opportunity.
Where it actually goes inside a commercial building
Here’s where the picture gets useful, because commercial energy use is far more concentrated than most owners expect.
Globally, HVAC is the single largest energy service in buildings at around 38% of consumption, rising to roughly 47% in the tertiary sector. In retail specifically, the concentration is starker still: lighting, cooling, and heating together represent about 60% of a typical retail building’s total energy use, and lighting alone consumes more than a quarter of its electricity — US retail buildings average 18.3 kWh per square foot each year.
Food retail changes the maths again. Because of refrigeration and HVAC load, food retailers consume roughly three times as much energy per square foot as non-food retailers. In a supermarket, refrigeration alone accounts for 40–60% of total electricity usage, with stores consuming around 50 kWh per square foot annually.
The practical implication is straightforward: in most commercial buildings, a handful of systems consume the overwhelming majority of the energy. Find and fix inefficiency in those systems and you’ve captured most of the available savings. But you cannot find it without measuring it.
Why the bill can’t tell you any of this
A utility meter measures your entire premises as a single point. It’s the equivalent of running a business with one bank account and no ledger — you know the balance fell, but not what you bought.
That single number hides everything that matters. It cannot tell you that a chiller is running through the night on an empty floor, that a compressor’s consumption has crept up 20% because it’s overdue for service, that one branch draws double what an identical branch across town does, or that your peak demand charge is being driven by three overlapping systems that could easily be staggered. Each of these is money leaving the building every day, invisibly, and none of them appear on a bill until they’ve already been paid.
What monitoring changes
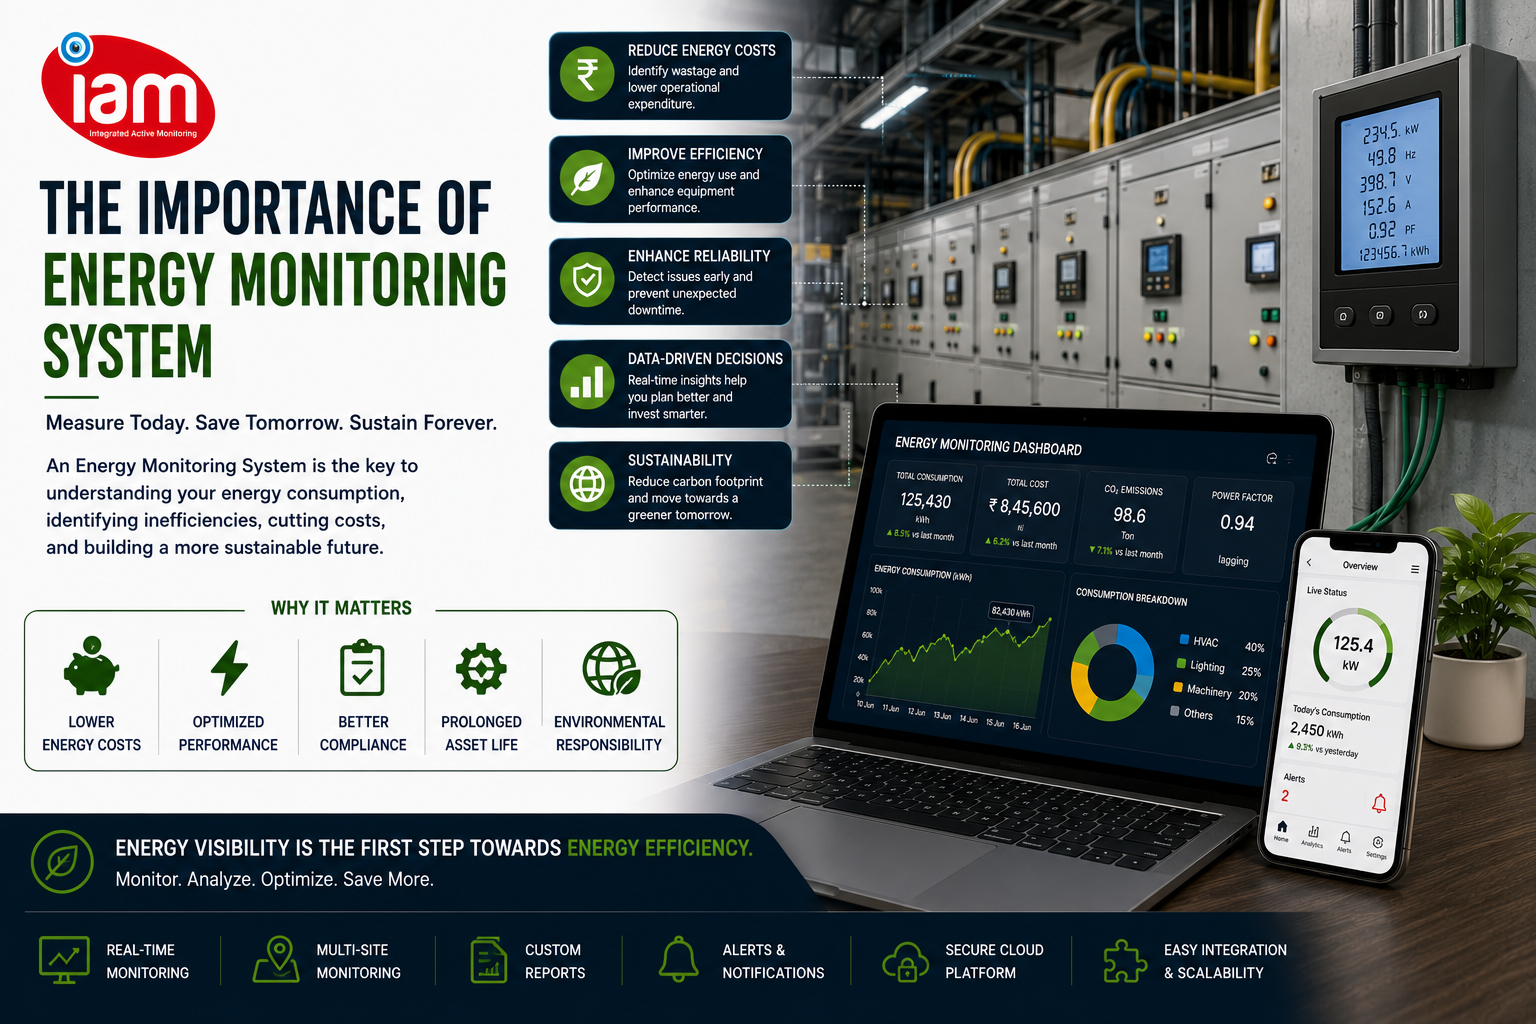
An energy monitoring system closes that gap by metering at the level where decisions actually get made — by device, by zone, by site, continuously and in real time.
The shift is from a monthly total to a live picture. Sub-metered data shows which assets consume what, when, so the biggest loads stop hiding inside an aggregate. Sudden consumption spikes surface as they happen, flagging faults, equipment drift, or misuse while you can still act on them. Baselines across multiple sites let you benchmark locations against each other and find the underperformers. And because it’s IoT-based, the data arrives on a dashboard rather than in an annual audit report.
For energy-intensive operations, this pairs naturally with environmental monitoring — particularly where refrigeration drives the load, since cold-storage temperature and humidity control and energy consumption are effectively the same system viewed from two angles. Both feed into a single centralized monitoring system, so energy sits alongside security, safety, and environment in one operational view instead of a separate spreadsheet nobody opens.
The India context
This matters more here than in most markets. Industry is the single largest consumer of electricity in India, accounting for roughly 41.8% of national consumption — which is why the practical measures that cut energy use in manufacturing plants translate so directly into margin. For multi-site retail chains and manufacturing operations running on thin operating margins against rising tariffs, energy is one of the few large costs that can be reduced without cutting anything the business actually needs.
Measure first, then save
Energy efficiency projects fail for a predictable reason: they start with solutions instead of data. Businesses replace lighting that wasn’t the problem, or upgrade a system that was already running well, and wonder why the bill barely moved.
Monitoring inverts that. It tells you where your money is actually going before you spend more of it, then proves whether the fix worked. Lower costs and a smaller carbon footprint follow from the same discipline — and both start with the decision to stop guessing. That’s the thinking behind building a more energy-efficient operation rather than simply hoping for a smaller bill.
Want to see where your energy actually goes? Talk to Smart IAM about energy monitoring for your business.